Stevens' High Retention, Graduation and Outcomes Rates Powered by Support and Opportunities for Students
The proof is in the numbers. The purpose is in the people.
As a premier, private research university in the heart of one of the most vibrant corporate and technology centers in the world, Stevens Institute of Technology thrives on data. We use it to explore the leading frontiers of artificial intelligence and to develop sustainable solutions for the future of our planet. We use it to plan for extreme weather and climate change, transform the future of health and medicine, bring quantum technologies into reality and advance the field of fintech.
We also use data to keep us informed of our students’ progress, to help them stay on track — academically and personally. The most recent data — on retention, graduation and outcomes rates — tell the story of a university that keeps its undergraduate students supported, engaged and successful during their time on campus and beyond.
The statistics speak for themselves. Our students are living proof.
94% Retention Rate / No. 45 Nationally*
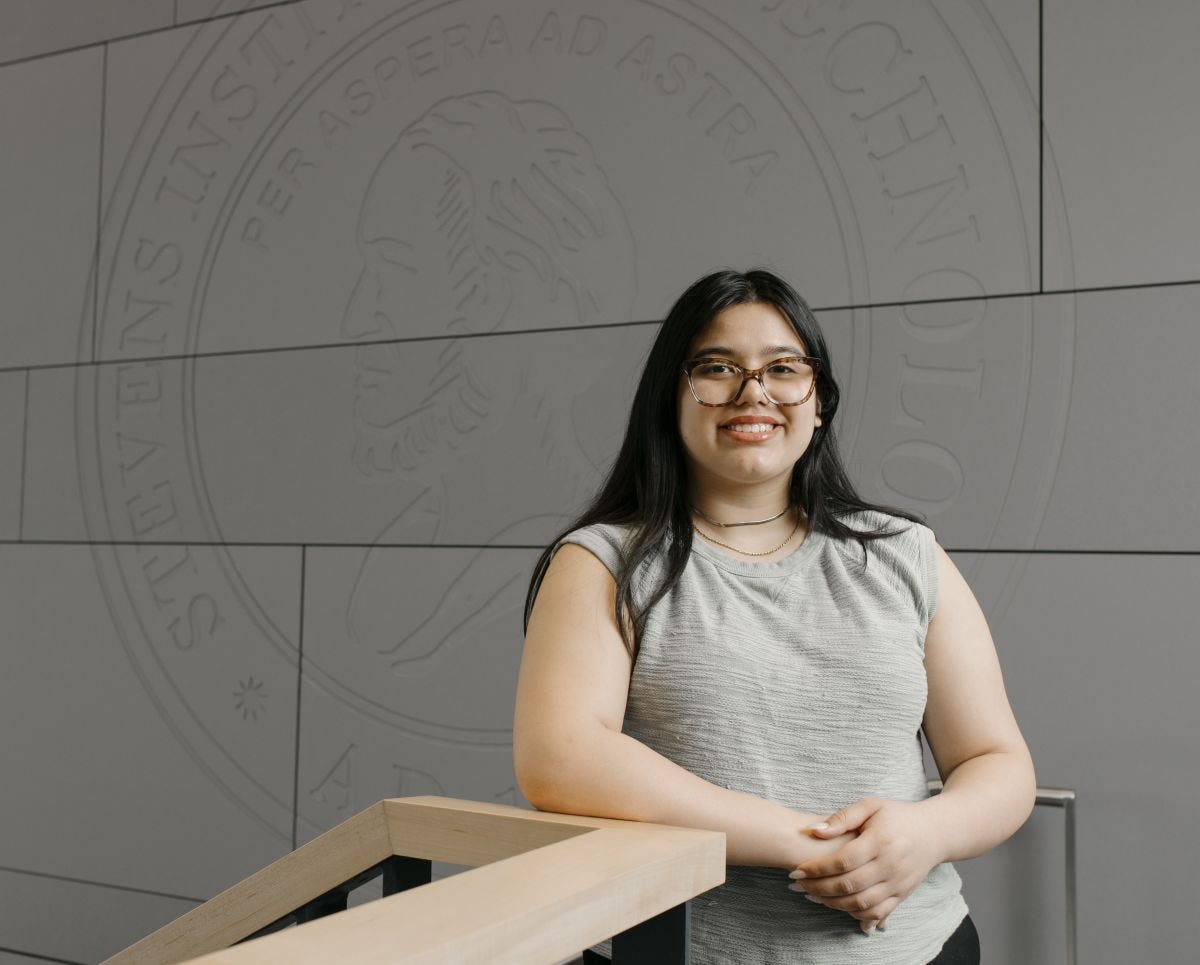
A Pinnacle Scholar, Camila Crespo chose Stevens because she recognized the support Stevens offers to help students pursue their interests and career goals.
“I knew Stevens wanted me to be successful both inside and outside of the classroom,” she says. “But transitioning into college life was a bigger change than I expected. I was in a completely different place with new people, and I was still unsure about the kind of degree I wanted to pursue. Stevens encouraged me to get involved on campus so I learned a lot about myself that I would not have otherwise.”
Now in her second year, Crespo calls Stevens “a second home” and says it has given her a newfound confidence in pursuing activities outside of her comfort zone.
“The support I have received from faculty and my peers has been overwhelming, and it’s one of the many reasons I am proud to be a Stevens student.”
90% 6-Year Graduation Rate / No. 45 Nationally*
As she prepares to receive her undergraduate degree, Paulina Georgoutsos ’24 M.S. ’25 is looking forward to completing her master’s degree next year and then it’s on to dental school. She cites the Stevens community as integral to her success.
“Outside of enriching course work in the classroom, Stevens has given me a support system that has been truly invaluable. From involvement in leadership organizations, to athletics, to the academic support center, I have felt connected to this community every step of the way,” she says. “The tight-knit, collaborative community here at Stevens sets us apart from other universities — as a smaller university, you are constantly met with friendly, familiar faces and there are so many resources and opportunities to help stay the course.”
96% Class of 2023 Outcomes Rate / $85,200 Average Salary*
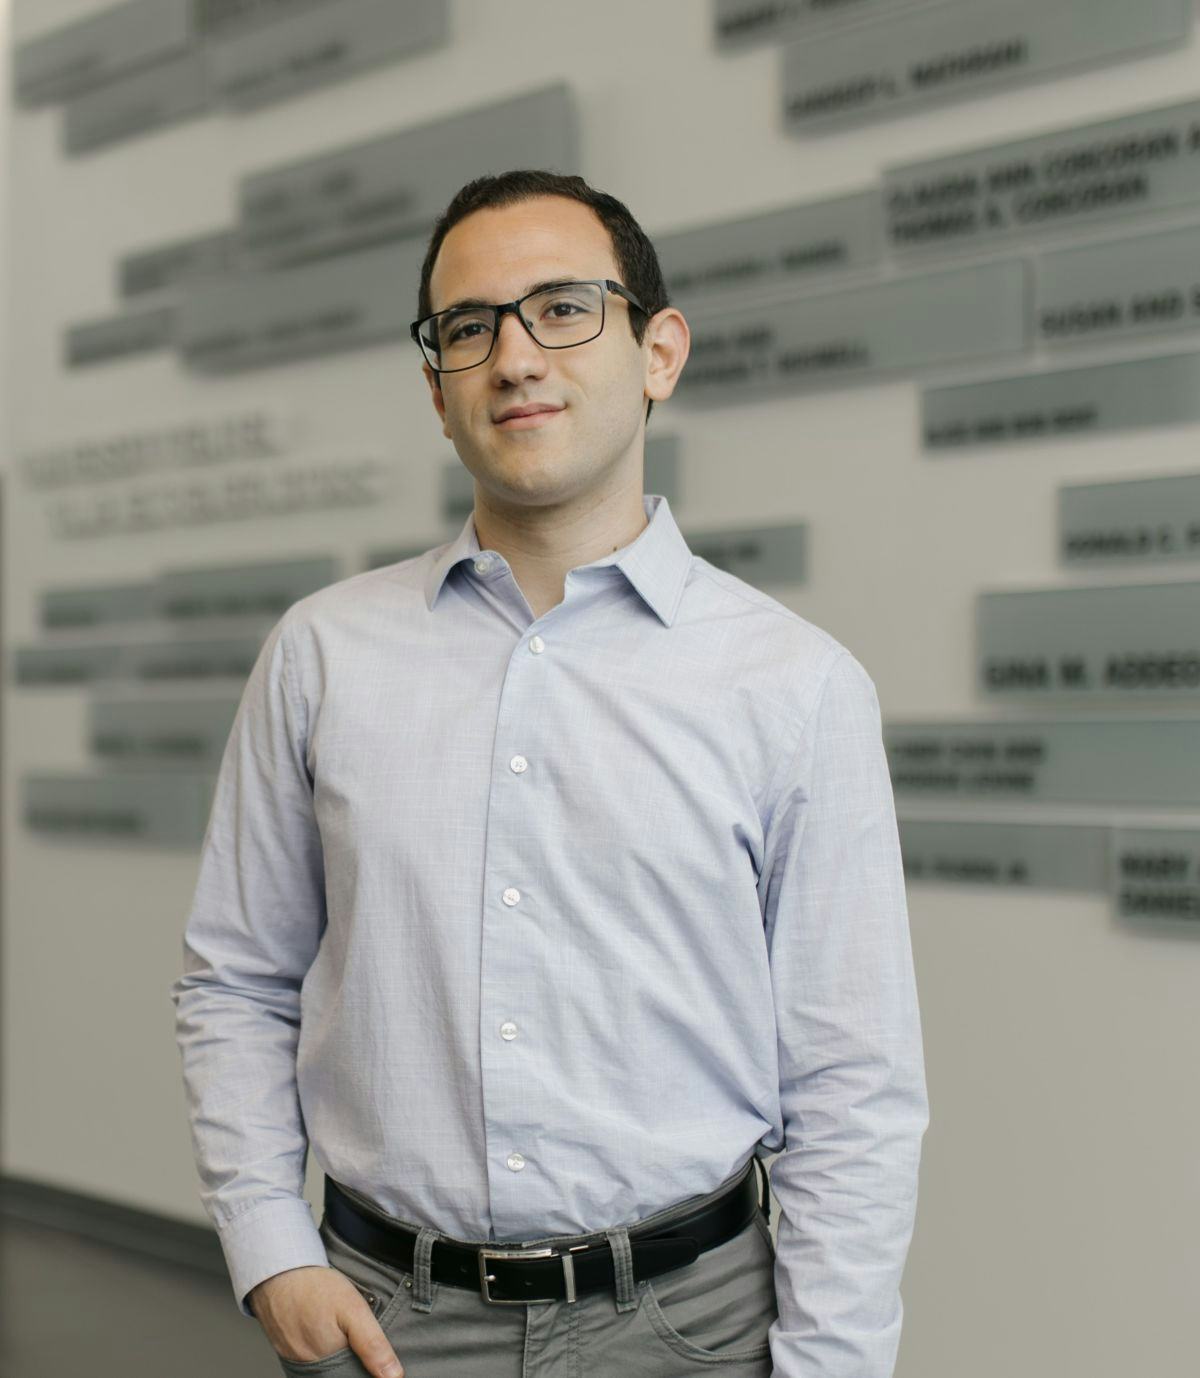
In the fall semester of his final year, James Lepore ’23 M.S. ’23 connected with the recruiting team at NBCUniversal at a Stevens career fair. Within a few weeks, he’d been offered and accepted a position in the company’s CORE Technology rotational program, where he’ll spend the next two years holding several software engineering positions across the organization before receiving a final placement at the end of the program.
“The co-op program at Stevens really built up both my technical and soft skills and helped me gain the knowledge, experience and confidence to thrive in a professional setting,” he said. “Also, the emphasis that Stevens places on integrating technology into every aspect of the curriculum — even courses that are not inherently technical — is unique. It prepared me well for a world where the influence of new technologies is everywhere.”
* Retention rate is the percentage of full-time, first-time bachelor’s degree–seeking undergraduates from the previous fall who are again enrolled in the current fall. Graduation rate is the percentage of first-time, first-year undergraduate students who complete their program. Outcomes rate is the percentage of graduates who achieved their desired career outcomes within six months of graduation.


